Defining displays (Generalities)
Index
Displays and layers
A display is one of the graphical outputs of your simulation. You can define several displays related to what you want to represent from your model execution. To define a display, use the keyword display inside the output scope, and specify a name (name facet).
experiment my_experiment type: gui {
    output {
	display "display1" {
	}
	display name:"display2" {
	}
    }
}
Other facets are available when defining your display:
- Use
backgroundto define a color for your background:
display "my_display" background: #red
- Use
refreshif you want to refresh the display when a condition is true (to refresh your display every number of steps, use the operatorevery)
display "my_display" refresh:every(10)
-
You can choose between two types of displays, by using the facet
type:java2Ddisplays will be used when you want to have 2D visualization. It is used for example when you manipulate charts. This is the default value for the facet type.opengldisplays allows you to have 3D visualization.
You can save the display on the disk, as a png file, in the folder name_of_model/models/snapshots, by using the facet autosave. This facet takes a boolean as argument (to allow or not to save each frame) or a point to define the size of your image (note that when no unit is provided, the unit is #px (pixel) ).
display my_display autosave: true type: java2D {}
The complete list of the display's facets are available in the documentation
Each display can be decomposed in one or several layers. Most of the time, all the layers are superimposed and cover all the environment space. In a 3D (OpenGL) display the layers can be split in order to be visualized separately (cf the page about displays).
Organize your layers
In one 2D display, you will have several types of layers, giving what you want to display in your model. You have a large number of layers available. You already know some of them, such as species, agents, grid, but other specific layers such as image (to display image) and graphics (to freely draw shapes/geometries/texts without having to define a species) are also available
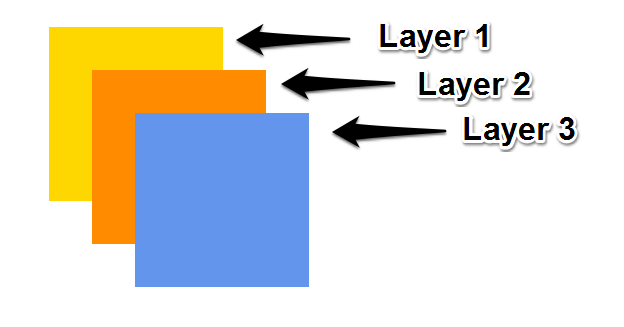
Each layer will be displayed in the same order as you declare them. The last declared layer will be above the others. As a consequence, any layer can hide elements of the lower levels.
Thus, the following code:
experiment expe type: gui {
    output {
        display my_display {
            graphics "layer1" {
                draw square(20) at: {10,10} color: #gold;
            }
            graphics "layer2" {
                draw square(20) at: {15,15} color: #darkorange;
            }
            graphics "layer3" {
                draw square(20) at: {20,20} color: #cornflowerblue;
            }
        }
    }
}
Will have this output:
Most of the layers have a transparency facet that you can use in order to see the layers which are under.
experiment expe type:gui {
    output {
	display my_display {
	    graphics "layer1" {
		draw square(20) at:{10,10} color:#darkorange;
	    }
	    graphics "layer2" transparency:0.5 {
		draw square(20) at:{15,15} color:#cornflowerblue;
	    }
	}
    }
}

To specify a position and a size for your layer, you can use the position and the size facets.
The position facet is used with a point type, between {0,0} and {1,1}, which corresponds to the position of the upper left corner of your layer in percentage of the display's dimensions. Thus, if you choose the point {0.5,0.5}, the upper left corner of your layer will be in the center of your display. By default, this value is {0,0} which corresponds to the top-left corner.
The size facet is used with a point type, between {0,0} and {1,1} also. It corresponds to the size occupied by the layer in percentage of the display's dimensions. By default, this value is {1,1} which represents 100% of the width and height available.
experiment expe type:gui {
    output {
	display my_display {
	    graphics "layer1" position:{0,0} size:{0.5,0.8} {
		draw shape color:#darkorange;
	    }
	    graphics "layer2" position:{0.3,0.1} size:{0.6,0.2} {
		draw shape color:#cornflowerblue;
	    }
	    graphics "layer3" position:{0.4,0.2} size:{0.3,0.8} {
	        draw shape color:#gold;
	    }
	}
    }
}

NB: displays can have a background, while graphics can't. If you want to put a background for your graphics, a solution can be to draw the shape of the world (which is, by default, a square 100m*100m).
A lot of other facets are available for the various layers. Please read the documentation of graphics for more information.
Example of layers
species layer
species allows the modeler to display all the agents of a given species in the current display. In particular, the modeler can choose the aspect used to display them.
Please read the documentation about species statement if you are interested.
grid layer
Similarly to species, grid allows the modeler to display all the agents of a given species in the current display, but only in the case where the species is a grid. The lines color can be specified. The inner color of the cells is determined by the color built-in attribute of grid agents. This is an optimized way of displaying the grid agents (compared to the species layers).
Please read the documentation about grid agents if you are interested.
agents layer
agents allows the modeler to display only the agents that fulfill a given condition.
Please read the documentation about agents statement if you are interested.
image layer
image allows the modeler to display an image (e.g. as the background of a simulation).
Please read the documentation about image statement if you are interested.
graphics layer
graphics allows the modeler to freely draw shapes/geometries/texts without having to define a species.
Please read the documentation about graphics statement if you are interested.