Graph Species
Using a graph in a model enables to easily show and manage interactions between agents: this can be the link between 2 points in space linked by a road or (non-spatial) interactions that exist between friends agents. It can also be a powerful tool to compute the shortest path between 2 points in space.
A graph is a concept that has several implementations in GAML: (i) it can be a datatype (graph), that can be created from a road shapefile (e.g. using as_edge_graph), (ii) it can be implemented as node and edge species,and (iii) it is a topology, i.e. an organisation of agents that influences the way distance and neighborhood is computed.
Index
Declaration
Declare a graph with handmade agents
To instantiate this graph, we rely on the two built-in species graph_node and base_edge. We need to define our own node and edge species as children species of the 2 built-in species. First, the node species must inherit from the abstract species graph_node, then the method related_to must be redefined and finally an auxiliary species that inherits from base_edge used to represent the edges of the generated graph must be declared.
A graph node is an abstract species that must redefine one method called related_to.
species my_node parent: graph_node edge_species: edge_agent{
  bool related_to(my_node other){
  	return true;
  }
}

species edge_agent parent: base_edge {
}
The method related_to returns a boolean and takes the agents from the current species as argument. If the method returns true, the two agents (the current instance and the one as argument) will be linked. The method is automatically called for each agent with each other agent of the given species in argument. Note that in the following example, related_to returns always true, so each agent will be linked to each other agent: we will get a complete graph.
model NewModel

global {
    int number_of_agents <- 5;

    init {
	create my_node number: number_of_agents;
    }
}

species my_node parent: graph_node edge_species: edge_agent {
    bool related_to (my_node other) {
	return true;
    }

    aspect base {
	draw circle(1) color: #green;
    }
}

species edge_agent parent: base_edge {
    aspect base {
	draw shape color: #blue;
    }
}

experiment MyExperiment type: gui {
    output {
	display MyDisplay type: java2D {
	    species my_node aspect: base;
	    species edge_agent aspect: base;
	}
    }
}

You can, for example, link 2 agents when they are closer than a certain distance.
Beware: The topology used in graph species is the graph topology and not the continuous topology. You can force the use of the continuous topology with the action using as follow:
bool related_to(my_node other){
    using topology(world) {
        return (self.location distance_to other.location < 20);
    }
}

The abstract mother species graph_node has an attribute my_graph, with the type graph. The graph type represents a graph composed of vertices linked with edges. This type has built-in attributes such as edges (the list of all the edges agents), or vertices (the list of all the vertices agents).
Declare a graph by using a geometry file
In most cases, you will have to construct a graph from an existing file (example: a "shp" file). In that case, you will have to first instantiate a species from the shape file (with the create statement, using the facet from). Then, you will have to construct a graph from the agent, using one of the available operators such as as_edge_graph.
model load_shape_file

global {
    file roads_shapefile <- file("../includes/road.shp");
    geometry shape <- envelope(roads_shapefile);
    graph road_network;

    init {
	create road from: roads_shapefile;
	road_network <- as_edge_graph(road);
    }
}

species road {
    aspect geom {
	draw shape color: #black;
    }
}

experiment main_experiment type:gui{
    output {
	display map {
	    species road aspect:geom;
	}
    }
}
Declare a graph with nodes and edges
Another way to create a graph is building it manually nodes by nodes, and then edges by edges, without using agent structures. Use the add_node operator and the add_edge operator to do so. Here is an example of how to do:
list<point> nodes <- [];
graph my_graph <- graph([]);

add point(0.0,0.0) to:nodes;
add point(90.0,90.0) to:nodes;
add point(20.0,20.0) to:nodes;
add point(40.0,50.0) to:nodes;
add point(100.0,0.0) to:nodes;

loop nod over: nodes {
    my_graph <- my_graph add_node(nod);
}

my_graph <- my_graph add_edge (nodes at 0::nodes at 2);
my_graph <- my_graph add_edge (nodes at 2::nodes at 3);
my_graph <- my_graph add_edge (nodes at 3::nodes at 1);
my_graph <- my_graph add_edge (nodes at 0::nodes at 4);
my_graph <- my_graph add_edge (nodes at 4::nodes at 1);
Using this solution, my_graph can have two types: it can be an a-spatial graph, or a spatial graph. The spatial graph will have a proper geometry, with segments that follow the position of your graph (you can access to the segments by using the built-in "segments"). The a-spatial graph will not have any shape.
global {
    graph my_spatial_graph<-spatial_graph([]);
    graph my_aspatial_graph<-graph([]);

    init {
	point node1 <- {0.0,0.0};
	point node2 <- {10.0,10.0};

        my_spatial_graph <- my_spatial_graph add_node(node1);
	my_spatial_graph <- my_spatial_graph add_node(node2);
	my_spatial_graph <- my_spatial_graph add_edge(node1::node2);
	write my_spatial_graph.edges;

	// the output is [polyline ([{0.0,0.0,0.0},{10.0,10.0,0.0}])]
	my_aspatial_graph <- my_aspatial_graph add_node(node1);
	my_aspatial_graph <- my_aspatial_graph add_node(node2);
	my_aspatial_graph <- my_aspatial_graph add_edge(node1::node2);
	write my_aspatial_graph.edges;
	// the output is [{0.0,0.0,0.0}::{10.0,10.0,0.0}]
    }
}
Useful operators with graph
Knowing the degree of a node
The operator degree_of returns the number of edges attached to a node. To use it, you have to specify a graph (on the left side of the operator), and a node (on the right side of the operator).
The following code (to put inside the node species) displays the number of edges attached to each node:
aspect base {
    draw string(my_graph degree_of node(5)) color:# black;
}
Get the neighbors of a node
To get the list of neighbors of a node, you should use the neighbors_of operator. On the left side of the operator, specify the graph you are using, and on the right side, specify the node. The operator returns the list of nodes located at a distance inferior or equal to 1, considering the graph topology.
species graph_agent parent: graph_node edge_species: edge_agent
{
  list<graph_agent> list_neighbors <- list<graph_agent>(my_graph neighbors_of (self));
}
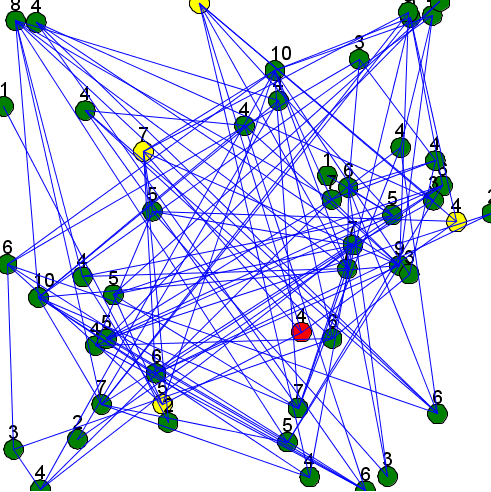
Here is an example of a model using those two previous concepts (a random node is chosen each step, displayed in red, and his neighbors are displayed in yellow):
model graph_model

global {
    int number_of_agents <- 50;

    init {
	create my_node number: number_of_agents;
    }

    reflex update {
	ask one_of(my_node) {
	    status <- 2;
	    do update_neighbors;
	}
    }
}

species my_node parent: graph_node edge_species: edge_agent {
    int status <- 0;
    list<int> list_connected_index;

    init {
	int i <- 0;
	loop g over: my_node {
	    if (flip(0.1)) {
		add i to:list_connected_index;
	    }
	    i <- i+1;
	}
    }

    bool related_to(my_node other){
        if (list_connected_index contains (my_node index_of other)) {
	    return true;
	}
        return false;
    }

    action update_neighbors {
	list<my_node> list_neighbors <- my_graph neighbors_of (self);

	loop neighb over: list_neighbors {
	    neighb.status <- 1;
	}
    }

    aspect base {
	if (status = 0) {
	    draw circle(2) color: #green border: #black;
	} else if (status = 1) {
	    draw circle(2) color: #yellow border: #black;
	} else if (status = 2) {
	    draw circle(2) color: #red border: #black;
	}

        draw string(my_graph degree_of self) color: #black size: 4 at: {self.location.x-1, self.location.y-2};
	status <- 0;
    }
}

species edge_agent parent: base_edge {
    aspect base {
	draw shape color: #blue;
    }
}

experiment MyExperiment type: gui {
    output {
	display MyDisplay type: java2D {
	    species my_node aspect: base;
	    species edge_agent aspect: base;
	}
    }
}
Compute the shortest path
To compute the shortest path to go from a point to another one, pick a source and a destination among the vertices you have for your graph. Store those values as point type.
point source;
point destination;
source <- point(one_of(my_graph.vertices));
destination <- point(one_of(my_graph.vertices));
Then, you can use the operator path_between to return the shortest path. To use this operator, you have to give the graph, then the source point, and the destination point. This operator returns a path type object.
path shortest_path;
shortest_path <- path_between (my_graph, source,destination);
Another operator exists, paths_between, that returns a list of shortest paths between two points. Please read the documentation to learn more about this operator.
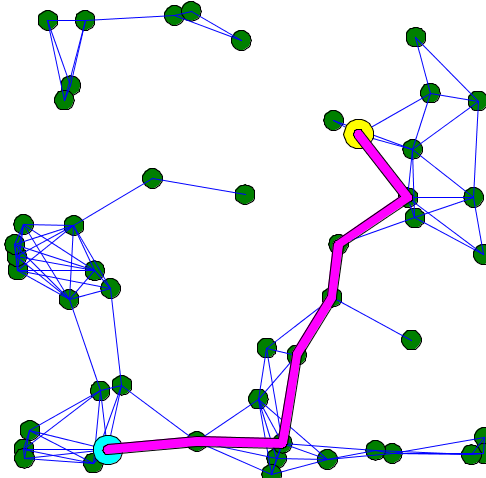
Here is an example of code that shows the shortest path between two points of a graph:
model graph_model

global {
    int number_of_agents <- 50;
    point source;
    point target;
    graph the_graph;
    path shortest_path;

    init {
	create my_node number: number_of_agents;
    }

    reflex pick_two_points {
	if (the_graph = nil) {
	    the_graph <- one_of(my_node).my_graph;
	}

	shortest_path <- nil;
	loop while: shortest_path = nil {
	    source <- (one_of(the_graph.vertices));
	    target <- (one_of(the_graph.vertices));
	    if (source != target) {
		shortest_path <- path_between(the_graph, source, target);
	    }
	}
    }
}

species my_node parent: graph_node edge_species: edge_agent {
    list<int> list_connected_index;

    init {
	int i <- 0;
	loop g over: my_node {
	    if (flip(0.1)) {
		add i to: list_connected_index;
	    }

	    i <- i + 1;
	}
    }

    bool related_to (my_node other) {
	using topology(world) {
	    return (self.location distance_to other.location < 20);
	}
    }

    aspect base {
	draw circle(2) color: #green border: #black;
    }
}

species edge_agent parent: base_edge {

    aspect base {
	draw shape color: #blue;
    }
}

experiment MyExperiment type: gui {
    output {
	display MyDisplay type: java2D {
	    species my_node aspect: base;
	    species edge_agent aspect: base;
	    graphics "shortest path" {
		if (shortest_path != nil) {
		    draw circle(3) at: source color: #yellow border: #black;
		    draw circle(3) at: target color: #cyan border: #black;
		    draw (shortest_path.shape + 1) color: #magenta;
		}
	    }
	}
    }
}
Control the weight in graph
You can add a map of weight for the edges that compose the graph. Use the operator with_weights to put weights in your graph. The graph has to be on the left side of the operator, and the map has to be on the right side. In the map, you have to put edges as key, and the weight for that edge as value. One common use is to put the distance as weight:
my_graph <- my_graph with_weights (my_graph.edges as_map (each::geometry(each).perimeter));
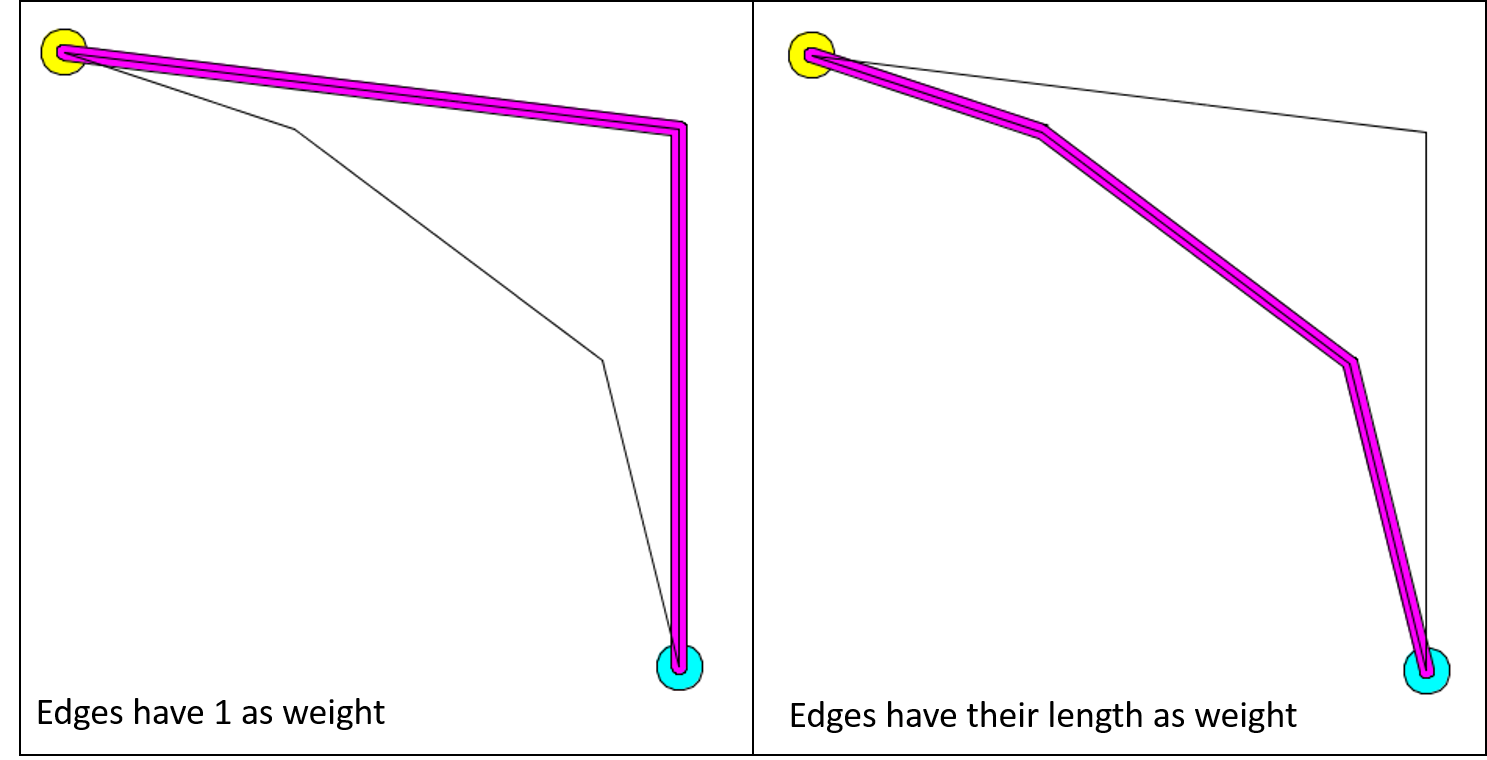
The calculation of the shortest path can change according to the weight you choose for your edges. For example, here is the result of the calculation of the shortest path when all the edges have 1 as weight value (it is the default graph topology), and when the edges have their length as weight.
Here is an example of implementation:
model shortest_path_with_weight

global {
    graph my_graph<-spatial_graph([]);
    path shortest_path;
    list<point> nodes;

    init {
	add point(10.0,10.0) to:nodes;
	add point(90.0,90.0) to:nodes;
	add point(40.0,20.0) to:nodes;
	add point(80.0,50.0) to:nodes;
	add point(90.0,20.0) to:nodes;

	loop nod over: nodes {
	    my_graph <- my_graph add_node(nod);
	}

	my_graph <- my_graph add_edge (nodes at 0::nodes at 2);
	my_graph <- my_graph add_edge (nodes at 2::nodes at 3);
	my_graph <- my_graph add_edge (nodes at 3::nodes at 1);
	my_graph <- my_graph add_edge (nodes at 0::nodes at 4);
	my_graph <- my_graph add_edge (nodes at 4::nodes at 1);

	// comment/decomment the following line to see the difference.
	my_graph <- my_graph with_weights (my_graph.edges as_map (each::geometry(each).perimeter));

	shortest_path <- path_between(my_graph,nodes at 0, nodes at 1);
    }
}

experiment MyExperiment type: gui {
    output {
	display MyDisplay type: java2D {
	    graphics "shortest path" {
		if (shortest_path != nil) {
		    draw circle(3) at: point(shortest_path.source) color: #yellow;
		    draw circle(3) at: point(shortest_path.target) color: #cyan;
		    draw (shortest_path.shape+1) color: #magenta;
		}
		loop edges over: my_graph.edges {
		    draw geometry(edges) color: #black;
		}
	    }
	}
    }
}